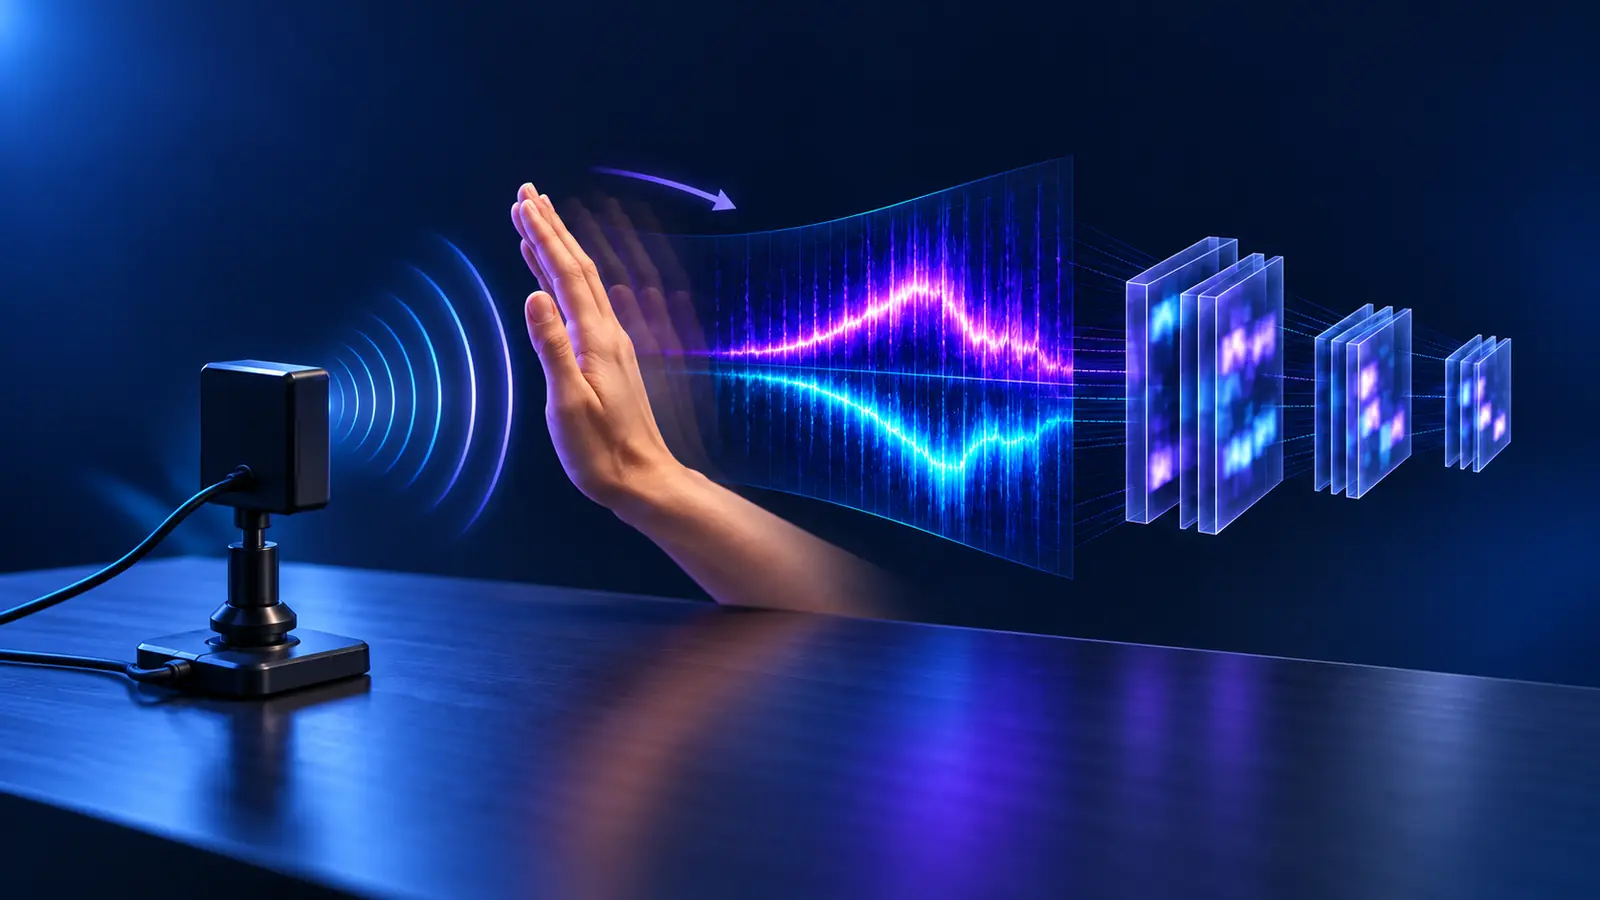
Kim and Toomajian’s 2016 study showed that a compact 5.8 GHz continuous-wave Doppler radar and a small convolutional neural network could classify ten pre-segmented hand gestures from micro-Doppler spectrograms with 85.6% average accuracy. That was a meaningful proof of concept: the radar supplied no range image, and the network learned directly from time–frequency patterns rather than from a manually designed feature vector.
But the paper’s most useful result was not its headline score. When the authors retained only seven more separable gestures, accuracy rose to 93.1%. When the viewing aspect changed to 45 degrees, it fell to 57.5%. When the same trained model saw gestures from a second participant, it reached 71.5%. The experiment therefore demonstrated both the promise of spectrogram-based deep learning and the physical limits that a classifier cannot simply learn away.
Short answer: the study established that a CNN could discriminate a controlled vocabulary of radar micro-Doppler gestures from one known user. It did not establish user-independent, viewpoint-invariant or continuous gesture recognition. Its lasting lesson is that sensing geometry and gesture design matter at least as much as network depth.
The paper at a glance
| Paper | Hand Gesture Recognition Using Micro-Doppler Signatures With Convolutional Neural Network |
|---|---|
| Authors | Youngwook Kim and Brian Toomajian |
| Published | IEEE Access, Volume 4, pages 7125–7130, 2016 |
| Radar | 5.8 GHz continuous-wave Doppler radar with quadrature output; 4.5 dBm average transmit power and a 60-degree antenna beamwidth |
| Main dataset | Ten gesture classes, 50 repetitions per class, 500 examples in total, collected from one participant at an average distance of about 10 cm |
| Model input | Two-second spectrogram crops resized to 60 × 60 pixels and scaled to the interval [0, 1] |
| Network | Three convolutional stages using 5 × 5 filters, with 5, 4 and 2 filters respectively, 2:1 pooling, and a final fully connected classifier |
| Main reported result | 85.6% average accuracy for ten gestures; 93.1% after reducing the vocabulary to seven gestures |
| Correct interpretation | An early controlled feasibility study, not a deployment-ready or unseen-user benchmark |
The complete six-page article is available through its IEEE DOI record. All numerical results below are attributed to that paper unless another source is named.
Why this study still matters
By 2016, convolutional neural networks had transformed image recognition, and researchers were beginning to ask whether a radar spectrogram could be treated as a learnable image. Kim and Moon had already applied a deep CNN to human detection and full-body activity classification from micro-Doppler signatures earlier that year. The hand-gesture study was therefore not the first use of a CNN on radar micro-Doppler. Its distinguishing move was to combine a simple range-free Doppler sensor, a ten-class hand vocabulary and a compact CNN in one short-range experiment (Kim and Moon, 2016).
That combination raised three questions that remain current:
- Can learned local patterns replace hand-engineered micro-Doppler descriptors?
- How much gesture information survives when a continuous-wave radar measures radial velocity but not range?
- Does high accuracy in a controlled recording survive a new angle, distance or person?
The paper answered the first question with a qualified yes, exposed the limit behind the second and performed unusually revealing stress tests for the third. That combination—not the age or size of the neural network—is why the study deserves to be revisited.
What the radar actually measured
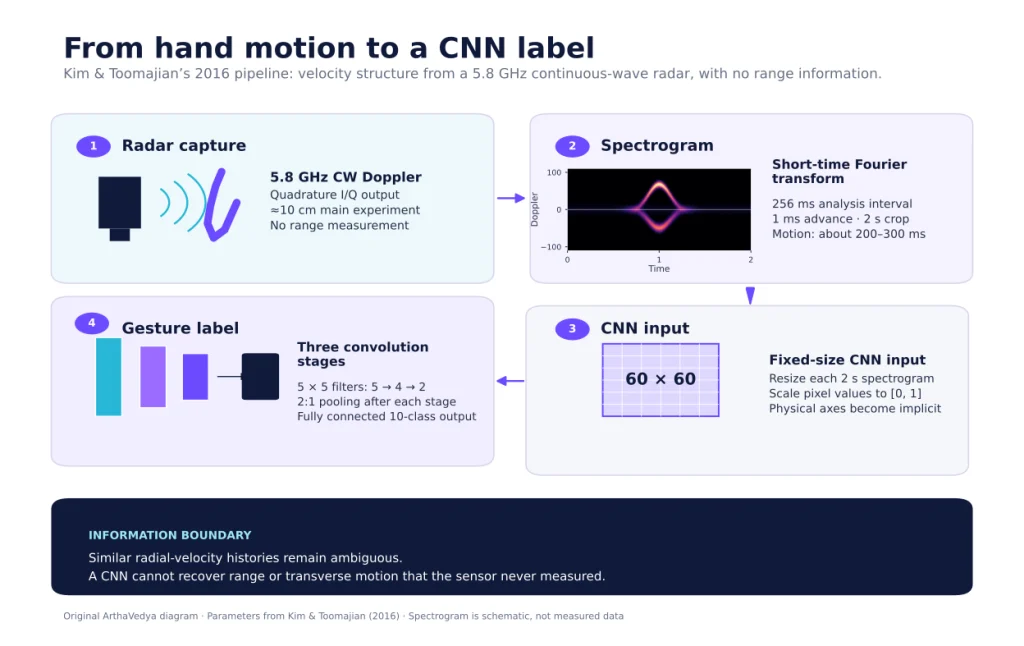
The experiment used a Bumblebee Doppler radar operating at 5.8 GHz. It produced in-phase and quadrature outputs and was specified for radial speeds from 2.6 cm/s to 2.6 m/s. The radar was fixed to a table, and the participant performed gestures inside its main beam at an average hand-to-sensor distance of approximately 10 cm.
A continuous-wave Doppler radar does not form a range profile. It transmits an essentially constant-frequency signal and measures the frequency or phase change caused by motion. For a monostatic radar, the instantaneous Doppler frequency is approximately
f_D(t)=\frac{2v_r(t)}{\lambda}=\frac{2v(t)\cos\theta(t)}{\lambda}.Here, vr is radial velocity, v is motion speed, θ is the angle between the motion and the radar line of sight, and λ is wavelength. The factor of two comes from the round trip between radar and target. The broader micro-Doppler literature explains how moving subcomponents add time-varying frequency structure around a target’s main return (Chen et al., 2006).
At 5.8 GHz, the wavelength is about 5.17 cm. A radial speed of 1 m/s therefore produces approximately 38.7 Hz of Doppler shift:
\lambda=\frac{c}{f_c}\approx 5.17\ \mathrm{cm},\qquad |f_D|\approx 38.7\ \mathrm{Hz}\ \text{for}\ |v_r|=1\ \mathrm{m/s}.The sensor’s stated velocity interval consequently corresponds to roughly 1–101 Hz in radial Doppler magnitude. Fingers, palm and wrist can contribute different instantaneous velocities, so one gesture becomes a set of overlapping ridges and energy patches rather than a single clean frequency line. ArthaVedya’s physics-first guide to how radar sees micro-Doppler motion develops this interpretation in more detail.
The sensor saw projection, not semantic direction
The cosine term is not a minor correction. Motion across the radar’s line of sight can have little radial velocity even when the hand moves quickly. Two gestures that look very different to a camera may therefore produce similar Doppler histories, while a small change in wrist orientation can substantially change the radar signature.
The authors confronted this problem when defining four swipe classes. They reported deliberately different execution details: one swipe used a quick snap with the wrist and all fingers, another involved three fingers and different wrist travel, and the vertical swipes used other distances or finger configurations. Those choices made the classes more distinguishable to the sensor.
This is both sensible engineering and an important limitation. The CNN may have separated class-specific choreography—finger count, wrist travel and posture—not only the semantic direction “left,” “right,” “up” or “down.” A user who performs the same command differently may not preserve those auxiliary cues. Gesture vocabulary is therefore part of the sensing system, not a neutral list added after data collection.
From I/Q samples to a 60 × 60 image
The processing chain was compact:
- Record the quadrature Doppler signal. Multiple moving scattering regions contribute to the complex baseband return.
- Compute a short-time Fourier representation. The paper reports a 256 ms FFT analysis interval and a 1 ms time step.
- Crop a two-second window. The informative hand motion itself reportedly occupied about 200–300 ms inside that interval.
- Resize and scale. Every spectrogram became a 60 × 60 array with values mapped to [0, 1] before entering the CNN.
In general, a discrete spectrogram can be written as
S[m,k]=\left|\sum_{n=0}^{N-1}x[n]w[n-mH]\exp\!\left(-j\frac{2\pi kn}{N_{\mathrm{FFT}}}\right)\right|^2.The window w selects a local interval, H is the hop between adjacent spectra, and NFFT sets the sampled frequency grid. The resulting pixel is local time–frequency energy. It is not a photograph of the hand.
A 1 ms hop does not mean 1 ms time resolution
The reported 256 ms analysis interval is comparable to the 200–300 ms duration of a single gesture. Advancing that long window by 1 ms creates a densely sampled display, but neighbouring columns share almost all their underlying data. The hop controls how often the spectrum is evaluated; the window duration controls how sharply events can be localized in time.
That distinction matters when interpreting what the network learned. A long window can preserve fine Doppler separation while smearing gesture onset and reversal across time. Resizing the two-second spectrogram to 60 columns compresses the representation again. Neither choice is necessarily wrong, but both choices help define the classification problem. See the practical guide to choosing STFT parameters for radar micro-Doppler for the time–frequency trade-off.
The paper says that the spectrogram values were normalized to [0, 1], but it does not state whether the extrema were estimated per image, per training set or globally. Those procedures preserve different amplitude information. Per-image scaling, for example, can suppress distance-dependent energy changes; global scaling retains more of them but can be dominated by outliers. A faithful replication must declare the scope, clipping rule and logarithmic or linear intensity mapping.
What the CNN actually contributed
By current standards, the model was tiny. It contained three convolutional stages with only 5, 4 and 2 learned filters. Every filter was 5 × 5, each stage reduced spatial dimensions by 2:1 through pooling, and a fully connected layer produced the final class decision. The paper reports 90 training iterations and a batch size of two. Its architecture discussion describes rectified linear activations and dropout, although not every implementation setting needed for exact reproduction is specified.
A convolutional filter slides across the time–frequency image. During training, it can become responsive to local structures such as an inclined ridge, a compact burst, a positive-to-negative Doppler reversal or the repetition pattern of a double gesture. Pooling makes the later representation less sensitive to small shifts in where those structures occur.
That is the architectural intuition. It is not direct evidence of what this trained model used. The study did not present saliency maps, learned-filter visualizations, input ablations or a same-dataset comparison against a carefully tuned handcrafted baseline. It therefore showed that the complete CNN pipeline classified the clips; it did not prove that a particular ridge, finger component or physically meaningful micro-Doppler mechanism drove each decision.
| Tempting interpretation | Evidence-supported interpretation |
|---|---|
| The CNN understood the hand motion | The CNN found repeatable patterns correlated with labels in the supplied 60 × 60 spectrograms |
| No feature engineering was required | Learned filters replaced a handcrafted feature vector, but sensing, STFT, cropping, resizing and scaling remained engineered choices |
| Pooling made the model invariant | Pooling can tolerate small local shifts; it does not guarantee invariance to aspect angle, distance or user |
| Deep learning recovered missing information | The model could exploit only the radial-motion evidence retained by the CW radar and preprocessing |
The headline result—read precisely
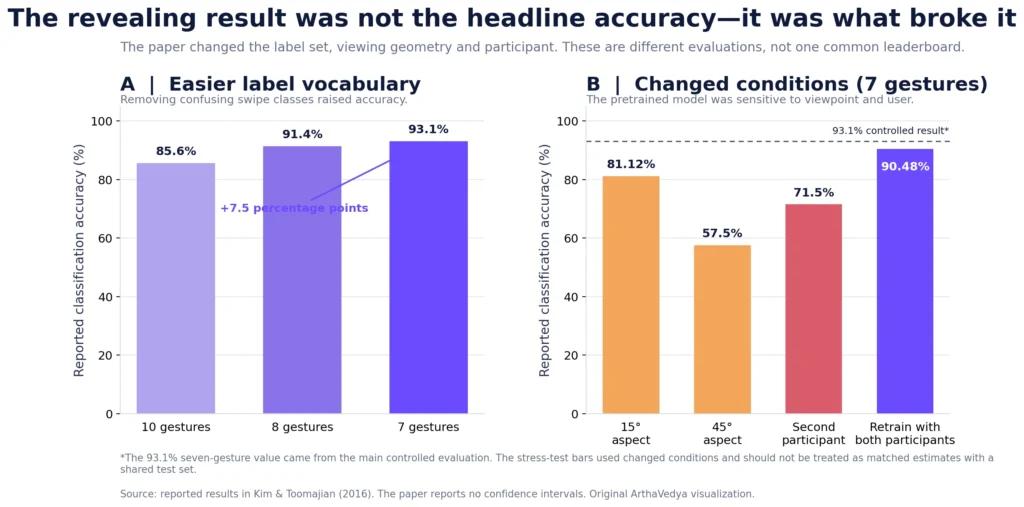
The main dataset contained 500 examples: ten gestures performed 50 times each by one participant. The authors describe using 90% for training and 10% for testing, repeated in a five-fold validation procedure. The reported average accuracy was 85.6% for all ten classes.
| Evaluated vocabulary | Classes removed from the original ten | Reported accuracy | Change from ten classes |
|---|---|---|---|
| Ten gestures | None | 85.6% | Reference |
| Eight gestures | Left-to-right and right-to-left swipes | 91.4% | +5.8 percentage points |
| Seven gestures | The same two classes plus up-to-down swipe | 93.1% | +7.5 percentage points |
The confusion matrix showed that the first two swipe classes were particularly difficult, consistent with their similar radial velocities. Removing them increased the score to 91.4%; removing a third swipe produced 93.1% for seven classes.
The correct lesson is not that 93.1% supersedes 85.6%. A seven-class system solves an easier and different problem. The result instead quantifies a design trade-off: a smaller vocabulary with more sensor-separable motions can be substantially more reliable. For a product interface, deleting an ambiguous command may be more effective than adding layers to the network.
The most important experiment: change the conditions
The authors did something more valuable than reporting another optimized fold. They challenged the seven-gesture model with changes in incident angle, aspect angle, distance and participant. The paper gives less sample-count detail for these stress tests than for the main dataset and reports no confidence intervals, so their percentages should not be treated as equally precise estimates. Their direction is nevertheless highly informative.
Aspect angle changed the signal itself
Using the previously trained model, the paper reported 81.12% accuracy at a 15-degree aspect angle and 57.5% at 45 degrees. The cosine projection predicts that a 45-degree rotation reduces the radial component of a fixed velocity to about 70.7% of its head-on value. In the experiment, the authors also observed reduced signal-to-noise ratio when the hand moved away from the antenna’s strongest direction. The model therefore faced shifted velocities, altered relative trajectories and weaker returns at the same time.
This is a distribution shift caused by physics, not merely by image appearance. Translation augmentation can move or scale spectrogram pixels, but it cannot guarantee a faithful simulation of how all finger and wrist components project at a new three-dimensional orientation.
Distance and a new participant exposed the same fragility
The study repeated gestures at 15, 30, 45 and 60 cm and reported a general decline in classification accuracy with distance, attributing it to lower signal-to-noise ratio and changes in the measured signatures. This is a reminder that normalization cannot automatically make a system distance-invariant: range changes affect received power, antenna illumination, clutter balance and the apparent motion inside a fixed time crop.
More importantly, the seven-gesture model trained on the first participant achieved 71.5% on a second participant. After the second person’s data were included and a new CNN was trained, accuracy rose to 90.48%. That recovery supports the value of training diversity, but it does not by itself prove generalization to an unseen third person. Once both people contribute to training, the evaluation no longer answers the unseen-user question unless another participant is held out.
The gap between 71.5% and 90.48% also says something deeper: “gesture” was not a fixed waveform. Anatomy, speed, wrist articulation and personal execution changed the signature enough to matter. More data help only when they cover the variations expected at deployment.
What the study proved—and what it did not
| Claim | Evidence in the paper | Boundary |
|---|---|---|
| A CW radar spectrogram contains useful hand-gesture information | 85.6% average accuracy across ten controlled classes | One participant and pre-segmented two-second clips |
| A small CNN can learn discriminative time–frequency patterns | Three convolutional stages classified resized spectrograms without a handcrafted feature vector | No same-data ablation established which patterns or whether CNN was uniquely necessary |
| Gesture-set design changes reliability | Accuracy rose from 85.6% to 93.1% after three confusing swipe classes were removed | The resulting seven-class task was easier and cannot be reported as ten-class performance |
| Viewing geometry matters | Accuracy fell to 57.5% at a 45-degree aspect angle | Small stress test; geometry and SNR changed together |
| User diversity in training can recover performance | 71.5% on the second participant rose to 90.48% after retraining with both participants | Not a subject-disjoint test of an unseen user |
The study did not test continuous gesture spotting, background rejection, accidental activation, multiple people, cross-room transfer, cross-device transfer or long-term repeatability. It did not show that ten arbitrary hand gestures can be recognized from any direction. It also did not show that CNNs outperform every handcrafted method, because no controlled same-dataset baseline comparison was reported.
None of those omissions invalidates the work. This was a concise feasibility paper. The appropriate retrospective question is whether its claim matched its evidence. The central claim—feasibility under controlled conditions—did.
A modern reproducibility audit
A reader can reconstruct the broad pipeline from the paper, but not every detail required to reproduce the numerical result. The following gaps are especially important today.
The split description is ambiguous
The abstract calls the held-out 10% validation data; the main text calls it testing data and also describes five-fold validation. Conventional five-fold cross-validation holds out 20% per fold, so the wording could instead mean five repeated 90/10 partitions. The paper does not state the random seed, exact fold membership or whether every repetition appeared in a held-out set exactly once.
The number of layers and filters was also “empirically optimized” for the highest accuracy. Without a separately described model-selection set, a modern reader cannot determine whether architecture choices were tuned independently of the folds used for the final score. This is an uncertainty in the reporting, not evidence that leakage occurred.
The effective sample size was small
Five hundred clips are 500 gesture performances, but all came from one person in one primary setup. Spectrogram columns separated by a 1 ms hop are highly overlapping measurements inside each clip; they are not independent additional gestures. The scientific unit for generalization is therefore the participant or recording session, not the number of pixels or time–frequency patches.
Pre-segmented classification avoided the spotting problem
Every input was a two-second crop associated with one intended gesture. A deployed interface must first decide whether a gesture is occurring, distinguish it from unrelated movement and choose its temporal boundaries. Clip accuracy does not measure false triggers per hour, missed events, onset delay or performance on unknown motions.
Several preprocessing choices were not fully specified
The paper reports the central timing and image dimensions, but an exact implementation would also need the baseband sampling rate, analysis window shape, FFT length in samples, overlap convention, frequency limits, magnitude or power conversion, linear or decibel mapping, clipping limits, normalization scope, crop alignment, convolution padding, dropout probability and initialization. The article itself provides no public dataset or code link.
If you need a public benchmark for reproducing or extending this type of experiment, see our comparison of radar-HAR datasets before choosing one.
This audit should be read in historical context. A six-page 2016 feasibility paper was not written under today’s expectations for dataset cards, code repositories and pre-registered evaluation protocols. Its missing details limit exact replication; they do not erase the insight of the experiment.
Kim and Toomajian versus Google Soli
Two influential 2016 studies approached radar gestures from different directions. Kim and Toomajian asked whether a CNN could classify a comparatively broad set of hand motions using only a 5.8 GHz Doppler spectrogram. Google’s Soli team co-designed miniature 60 GHz radar hardware, multiple signal representations, compact features and a deliberately narrow interaction vocabulary. Their headline accuracies are not directly comparable.
| Dimension | Kim and Toomajian (2016) | Soli (2016) |
|---|---|---|
| Primary question | Can a CNN classify hand gestures from micro-Doppler alone? | Can miniature mmWave radar become a practical fine-motion input sensor? |
| Radar | 5.8 GHz CW Doppler radar; no range | 60 GHz research radars, including FMCW and other architectures |
| Learning input | 60 × 60 spectrogram image | Engineered range, Doppler, phase, energy and motion features |
| Classifier | Three-stage CNN | Random forest plus temporal filtering |
| Main gesture vocabulary | Ten classes from one primary participant | Four evaluated classes from five participants |
| Headline metric | 85.6% average clip classification accuracy | 92.10% filtered per-gesture accuracy |
| Key limitation | No unseen-participant main evaluation; pre-cut clips | Same five participants in train and test sessions |
Soli’s 92.10% included temporal filtering and a different event-level metric, while Kim and Toomajian’s 85.6% covered more classes with a different radar, participant set and segmentation protocol. Ranking the two numbers would be scientifically meaningless. Their complementary contributions are more interesting: one emphasized learned spectrogram features; the other emphasized hardware–software–interaction co-design. Our separate breakdown explains what Google Soli actually proved (Lien et al., 2016).
Where the idea went next
Later systems enriched both the sensing input and the model. Skaria and colleagues used a 24 GHz continuous-wave radar with two receive antennas. Their CNN received two spectrograms plus an angle-of-arrival matrix and classified 14 gestures with accuracy exceeding 95% on their dataset (Skaria et al., 2019).
Kehelella and colleagues later combined a convolutional encoder–decoder with a vision transformer on that same two-antenna dataset and reported 98.3% accuracy. Their ablation study showed that the complete hybrid architecture outperformed the tested CNN and transformer variants on that evaluation (Kehelella et al., 2022).
Those values should not be placed beside 85.6% as a simple timeline of progress. The hardware, class definitions, people, splits and representations differ, and the 2022 result reuses the 2019 dataset. What changed more broadly was the design space: researchers added antennas, angle and range information, larger datasets, attention mechanisms and more demanding evaluation. The original question nevertheless survives every architectural upgrade: will the learned decision remain stable when the user, viewpoint, range, room or device changes?
How to repeat this study today
A modern replication should preserve the paper’s elegant core comparison—simple Doppler sensing plus learned spectrogram features—while making the claimed generalization explicit.
- Define the claim before collecting data. Decide whether the goal is personalized clip classification, unseen-user recognition, viewpoint robustness or continuous spotting. Each requires a different split and metric.
- Design a sensor-separable but semantically consistent vocabulary. Do not give different classes hidden cues such as different finger counts unless those cues are part of the intended command definition.
- Sample people and conditions deliberately. Cross participant, session, aspect angle, distance and environment rather than changing one nuisance factor only after training.
- Retain the earliest practical signal and metadata. Save complex I/Q, sampling rate, carrier, gain, antenna orientation, timestamps, trial boundaries and subject/session identifiers.
- Specify the entire spectrogram transform. Report window type and length, hop, FFT length, frequency crop, power scale, dynamic range, resize interpolation and normalization scope.
- Split before augmentation or windowing. Hold out complete participants for an unseen-user claim and complete sessions for a repeatability claim. Never allow derived views of one trial to cross partitions.
- Compare informative baselines. Include a transparent handcrafted-feature model, a small CNN, and ablations that remove Doppler sign, amplitude, phase or temporal order where applicable.
- Report deployment-relevant errors. Add macro F1, per-class and per-participant results, confidence intervals, confusion matrices, false activations per hour, missed events, decision delay and compute cost.
- Freeze a stress-test matrix. Evaluate held-out combinations of range, angle, speed and signal-to-noise ratio instead of showing only the best operating point.
- Release reproducible assets. Publish code, split manifests, preprocessing configuration and model-selection rules; publish data when consent, privacy and licensing permit.
For the engineering path from complex samples to group-aware evaluation, continue with the implementation guide to building a radar-HAR pipeline from raw ADC data.
Five lessons that outlast the architecture
- The sensor sets the information ceiling. A range-free CW radar cannot reveal transverse motion or range structure that it never measured.
- The gesture vocabulary is an engineering variable. Removing ambiguous commands can improve reliability more than increasing model capacity.
- Preprocessing remains feature engineering. A CNN may learn its filters, but the STFT, crop, resize and normalization determine what it is allowed to learn.
- Average accuracy is conditional. A score belongs to a particular class set, participant population, geometry and split—not to the architecture in isolation.
- Failure tests can be the strongest contribution. The angle and second-participant results revealed the real research problem more clearly than another optimized same-user score would have.
The verdict
Hand Gesture Recognition Using Micro-Doppler Signatures With Convolutional Neural Network deserves attention not because its network remains state of the art, but because its experiment captured a durable transition. Radar researchers no longer had to specify every discriminative ridge, centroid and duration by hand; a CNN could learn useful local structure from a time–frequency representation.
The paper was also more honest than a single 85.6% headline suggests. It showed that confusing gestures became easier when deleted, that aspect angle could collapse performance and that another person could shift the data substantially. The authors concluded that diverse scenarios and multiple participants would be required for practical recognition. Later research has added richer sensors and larger models, but it has not made that requirement disappear.
What this classic study proved was modest and important: micro-Doppler spectrograms were learnable. What it revealed was even more important: learned does not mean invariant.
Key takeaways
- The 2016 study classified ten hand gestures from range-free 5.8 GHz Doppler spectrograms with 85.6% average accuracy.
- The main dataset contained 500 examples from one participant, so the score did not establish unseen-user generalization.
- Reducing the vocabulary to seven more separable gestures raised accuracy to 93.1%, demonstrating a task-design trade-off rather than an improved ten-class model.
- The seven-gesture model fell to 57.5% at a 45-degree aspect angle and 71.5% on a second participant.
- A 1 ms spectrogram hop did not provide 1 ms independent time resolution because the reported analysis interval was 256 ms.
- The CNN learned correlations in the processed image; the study did not establish which physical features drove its decisions.
- A modern replication should use participant-disjoint splits, exact preprocessing records, continuous-background tests, uncertainty estimates and explicit stress conditions.
References
- Kim, Y., & Toomajian, B. (2016). Hand Gesture Recognition Using Micro-Doppler Signatures With Convolutional Neural Network. IEEE Access, 4, 7125–7130.
- Chen, V. C., Li, F., Ho, S.-S., & Wechsler, H. (2006). Micro-Doppler Effect in Radar: Phenomenon, Model, and Simulation Study. IEEE Transactions on Aerospace and Electronic Systems, 42(1), 2–21.
- Kim, Y., & Moon, T. (2016). Human Detection and Activity Classification Based on Micro-Doppler Signatures Using Deep Convolutional Neural Networks. IEEE Geoscience and Remote Sensing Letters, 13(1), 8–12.
- Lien, J., Gillian, N., Karagozler, M. E., et al. (2016). Soli: Ubiquitous Gesture Sensing with Millimeter Wave Radar. ACM Transactions on Graphics, 35(4), Article 142.
- Skaria, S., Al-Hourani, A., Lech, M., & Evans, R. J. (2019). Hand-Gesture Recognition Using Two-Antenna Doppler Radar With Deep Convolutional Neural Networks. IEEE Sensors Journal, 19(8), 3041–3048.
- Kehelella, K., Leelarathne, G., Marasinghe, D., et al. (2022). Vision Transformer with Convolutional Encoder–Decoder for Hand Gesture Recognition Using 24-GHz Doppler Radar. IEEE Sensors Letters, 6(10).